Tutorial
This page is a tutorial for the abqcy project.
It will guide you through the whole workflow of using abqcy to write an Abaqus user subroutine,
create the model, extract the outout data, and visualize the results in a single command.

1. Write the user subroutine
The Abaqus user subroutine can be written in a Cython file. The subroutine is very similar to a Abaqus C/C++ subroutine, except that it is written in Cython syntax. Check Examples for some simple examples.
2. Create the model as an Abaqus input file
You can use the Python script to create an Abaqus model, check
abqpy tutorials for a simple example.
Noted that in the Python script, you should save the model into an Abaqus input file (.inp),
so that the abqcy can read the model from the input file. For example:
# Job
job = mdb.Job(name="element", model="Model-1")
job.writeInput()
If you are not familiar with Abaqus Python scripting, you can also use the Abaqus/CAE GUI to create an input file directly.
3. Write Python script to extract the output data from the Abaqus output database
You can use the Python script to extract the output data from the Abaqus output database (.odb).
You can also find a simple example in the abqpy tutorials.
Typically, this Python script will extract the output data from the Abaqus output database and save it into a data file。
4. Visualize the results
Data extracted from the Abaqus output database can be visualized using another Python script. For example, you can use the matplotlib library to plot the data.
5. Run the abqcy command
After all the above steps are completed, you can run the abqcy run to finish the whole workflow:
abqcy run --model=<script-or-inp> --user=<subroutine> --post=<script> --visualiation=<script>
In chronological order, the abqcy run command will:
Generate an Abaqus input file from the Python script, if the
--modeloption is a Python script.Compile the user subroutine to an object file (
.obj), if the--useroption is a Cython file.Run the Abaqus analysis with the
abaqus input=<inp> user=<obj>command.Run the post-processing Python script with the
abaqus cae noGUI=<script>command.Run the visualization Python script with the
python <script>command, using the Python interpreter (instead of the Abaqus command) to visualize the results.
Example
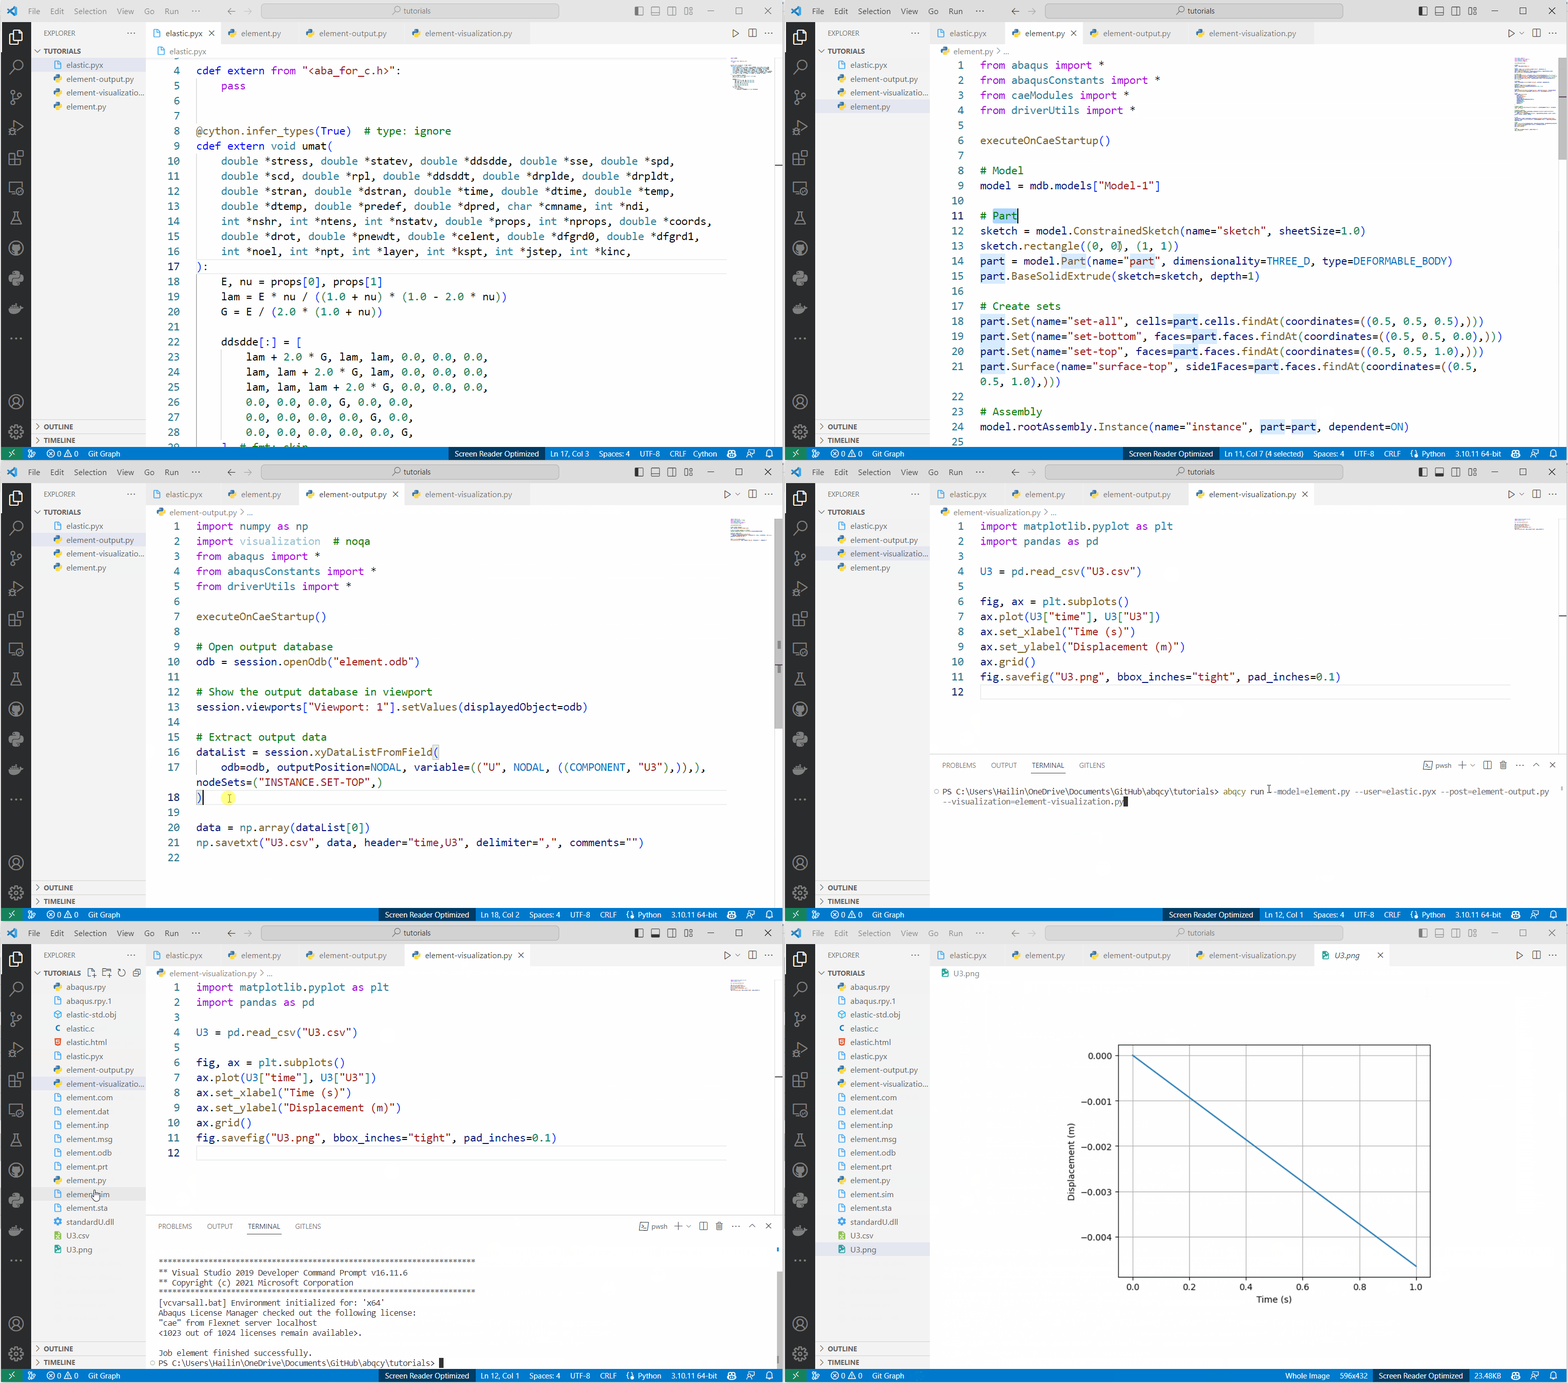
The following is an example of scripts required by the abqcy run command:
 1import cython
 2
 3
 4cdef extern from "<aba_for_c.h>":
 5    pass
 6
 7
 8@cython.infer_types(True)  # type: ignore
 9cdef extern void umat(
10    double *stress, double *statev, double *ddsdde, double *sse, double *spd,
11    double *scd, double *rpl, double *ddsddt, double *drplde, double *drpldt,
12    double *stran, double *dstran, double *time, double *dtime, double *temp,
13    double *dtemp, double *predef, double *dpred, char *cmname, int *ndi,
14    int *nshr, int *ntens, int *nstatv, double *props, int *nprops, double *coords,
15    double *drot, double *pnewdt, double *celent, double *dfgrd0, double *dfgrd1,
16    int *noel, int *npt, int *layer, int *kspt, int *jstep, int *kinc,
17):
18    E, nu = props[0], props[1]
19    lam = E * nu / ((1.0 + nu) * (1.0 - 2.0 * nu))
20    G = E / (2.0 * (1.0 + nu))
21
22    ddsdde[:] = [
23        lam + 2.0 * G, lam, lam, 0.0, 0.0, 0.0,
24        lam, lam + 2.0 * G, lam, 0.0, 0.0, 0.0,
25        lam, lam, lam + 2.0 * G, 0.0, 0.0, 0.0,
26        0.0, 0.0, 0.0, G, 0.0, 0.0,
27        0.0, 0.0, 0.0, 0.0, G, 0.0,
28        0.0, 0.0, 0.0, 0.0, 0.0, G,
29    ]  # fmt: skip
30    for i in range(6):
31        for j in range(6):
32            stress[i] += ddsdde[6 * i + j] * dstran[j]
 1from abaqus import *
 2from abaqusConstants import *
 3from caeModules import *
 4from driverUtils import *
 5
 6executeOnCaeStartup()
 7
 8# Model
 9model = mdb.models["Model-1"]
10
11# Part
12sketch = model.ConstrainedSketch(name="sketch", sheetSize=1.0)
13sketch.rectangle((0, 0), (1, 1))
14part = model.Part(name="part", dimensionality=THREE_D, type=DEFORMABLE_BODY)
15part.BaseSolidExtrude(sketch=sketch, depth=1)
16
17# Create sets
18part.Set(name="set-all", cells=part.cells.findAt(coordinates=((0.5, 0.5, 0.5),)))
19part.Set(name="set-bottom", faces=part.faces.findAt(coordinates=((0.5, 0.5, 0.0),)))
20part.Set(name="set-top", faces=part.faces.findAt(coordinates=((0.5, 0.5, 1.0),)))
21part.Surface(name="surface-top", side1Faces=part.faces.findAt(coordinates=((0.5, 0.5, 1.0),)))
22
23# Assembly
24model.rootAssembly.Instance(name="instance", part=part, dependent=ON)
25
26# Material
27material = model.Material(name="material")
28material.UserMaterial(mechanicalConstants=(2.1e11, 0.3))
29material.Depvar(n=2)
30
31# Section
32model.HomogeneousSolidSection(name="section", material="material", thickness=None)
33part.SectionAssignment(region=part.sets["set-all"], sectionName="section")
34
35# Step
36step = model.StaticStep(
37    name="Step-1",
38    previous="Initial",
39    description="",
40    timePeriod=1.0,
41    timeIncrementationMethod=AUTOMATIC,
42    maxNumInc=100,
43    initialInc=0.01,
44    minInc=0.001,
45    maxInc=0.1,
46)
47
48# Output request
49field = model.FieldOutputRequest("F-Output-1", createStepName="Step-1", variables=("S", "E", "U"))
50
51# Boundary condition
52bottom_instance = model.rootAssembly.instances["instance"].sets["set-bottom"]
53bc = model.DisplacementBC(
54    name="BC-1", createStepName="Initial", region=bottom_instance, u1=SET, u2=SET, u3=SET, ur1=SET, ur2=SET, ur3=SET
55)
56
57# Load
58top_instance = model.rootAssembly.instances["instance"].surfaces["surface-top"]
59pressure = model.Pressure("pressure", createStepName="Step-1", region=top_instance, magnitude=1e9)
60
61# Mesh
62elem1 = mesh.ElemType(elemCode=C3D8I, elemLibrary=STANDARD, secondOrderAccuracy=OFF)
63part.setElementType(regions=(part.cells,), elemTypes=(elem1,))
64part.seedPart(size=0.1)
65part.generateMesh()
66
67# Job
68job = mdb.Job(name="element", model="Model-1")
69job.writeInput()
 1import numpy as np
 2import visualization  # noqa
 3from abaqus import *
 4from abaqusConstants import *
 5from driverUtils import *
 6
 7executeOnCaeStartup()
 8
 9# Open output database
10odb = session.openOdb("element.odb")
11
12# Show the output database in viewport
13session.viewports["Viewport: 1"].setValues(displayedObject=odb)
14
15# Extract output data
16dataList = session.xyDataListFromField(
17    odb=odb, outputPosition=NODAL, variable=(("U", NODAL, ((COMPONENT, "U3"),)),), nodeSets=("INSTANCE.SET-TOP",)
18)
19
20data = np.array(dataList[0])
21np.savetxt("U3.csv", data, header="time,U3", delimiter=",", comments="")
 1import matplotlib.pyplot as plt
 2import pandas as pd
 3
 4U3 = pd.read_csv("U3.csv")
 5
 6fig, ax = plt.subplots()
 7ax.plot(U3["time"], U3["U3"])
 8ax.set_xlabel("Time (s)")
 9ax.set_ylabel("Displacement (m)")
10ax.grid()
11fig.savefig("U3.png", bbox_inches="tight", pad_inches=0.1)
1abqcy run --model=element.py --user=elastic.pyx --post=element-output.py --visualization=element-visualization.py
Note
You can check all the files in the docs/tutorials
folder of the abqcy repository.